image

StreamScope XM Dashboard logo

ATSC 3.0 dashboard designer
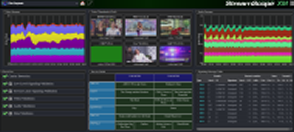
ATSC 3.0 IP input dashboard example

StreamScope® XM Dashboard software enables TV engineers and other personnel to design their own customized web-based dashboards displaying real-time data from multiple ATSC 3.0 IP and RF streams.

Create multi-component custom dashboards

You can design your dashboards from a large selection of predefined KPI components such as thumbnails, graphs, bar charts, and histograms. The graphic components can be arranged and formatted into layouts that best meet your monitoring needs.

For monitoring ATSC 3.0 IP and RF inputs
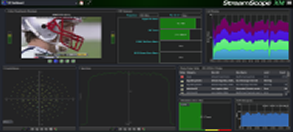
ATSC 3.0 RF input dashboard example

IP (top) and RF (bottom) dashboard examples. Click to enlarge.

User-friendly StreamScope XM dashboards display ATSC 3.0 IP and RF multiple stream data collected from a StreamScope XM Analyzer, making it easy to monitor and maintain high QoS and performance across NextGen TV networks.

To view a free webinar, click StreamScope XM Dashboard. ►

StreamScope XM Dashboard KPI benefits:

  • Design your dashboards with the KPI components you want to monitor.
  • Customize dashboard structures and layouts to fit your needs.
  • Integrate with StreamScope XM Analyzers.
  • Rely on industry-leading, U.S.-based customer support.

StreamScope XM Dashboard KPI components:

  • Rotating and grid layout video thumbnails
  • Video, audio, and data stream bitrates
  • RF signal properties: level, SNR, etc.
  • RF Cartesian graphs: constellations, impulse, spectrum, and transfer
  • PLP bandwidth bar charts and histograms
  • Malformed and unsignaled packets
  • Analysis rule statuses and summaries
  • Service guide schedules and program data
  • L1 basic, detail, and PLP settings
  • Bootstrap, subframe, and TX ID settings
  • BCH and modulation error rates
  • LDPC average iterations, maximum iterations, and bit error rates
  • And more